可视化 Alloy 收集的指标
更新时间:2025-07-14 07:26:00
Alloy 内置了众多可以导出指标的 Exporters,例如 Blackbox Exporter、Elasticsearch Exporter、Kafka Exporter、Redis Exporter、Postgres Exporter 等。安装 Alloy 后用户无需再分别安装单独的 Exporter,使用 prometheus.remote_write 组件即可将上述 Exporters 暴露的指标写入 Prometheus 及其兼容的存储后端。然后借助 Grafana 控制台可视化 Alloy 收集的指标。
下面是一个使用 Alloy 内置的 Blackbox Exporter 导出指标并写入 Prometheus 的示例。
步骤 1:创建配置字典
在 Grafana Alloy for WizTelemetry 的扩展组件配置中,可以直接提供 Alloy 配置,也可以指定外部 ConfigMap 提供配置。建议先创建 ConfigMap,然后在扩展组件配置中指定。
以 Blackbox Exporter 为例,在集群节点上,执行以下命令,创建配置字典 blackbox-modules。
cat <<EOF | kubectl apply -f -
apiVersion: v1
kind: ConfigMap
metadata:
  name: blackbox-modules
  namespace: kubesphere-monitoring-system
data:
  blackbox_modules: |
    modules:
      http_2xx:
        prober: http
        timeout: 5s
EOF
步骤 2:修改扩展组件配置
修改 Grafana Alloy for WizTelemetry 的扩展组件配置,以抓取并导出 Blackbox Exporter 的指标并写入 Prometheus。
alloy:
  alloy:
    configMap:
      # 是否自动创建 configmap
      create: true
      # 配置内容
      content: |
        // 指定 blackbox exporter 配置的 configmap。
        remote.kubernetes.configmap "blackbox" {
          namespace = "kubesphere-monitoring-system"
          name = "blackbox-modules"
        }

        prometheus.exporter.blackbox "example" {
          config = remote.kubernetes.configmap.blackbox.data["blackbox_modules"]
          // 指定 blackbox exporter 的目标配置,通过 labels 指定自定义的标签。
          target {
            name    = "prometheus"
            address = "https://www.prometheus.io"
            module  = "http_2xx"
            labels = {
              "address" = "https://www.prometheus.io",
            }
          }
        }

        // 指标转发
        prometheus.scrape "exporter" {
          targets    = prometheus.exporter.blackbox.example.targets
          forward_to = [prometheus.remote_write.default_storage_backend.receiver]
        }

        // 指定远程写入 Prometheus 配置
        prometheus.remote_write "default_storage_backend" {
          endpoint {
            url = "http://prometheus-k8s.kubesphere-monitoring-system.svc:9090/api/v1/write"
          }
        }
      # 当使用外部 configmap 时,需要指定 configmap 的名称,当 create 为 false 时启用
      name: null
      # 配置 map 的 key
      key: null
步骤 3:查看 Blackbox Exporter 指标
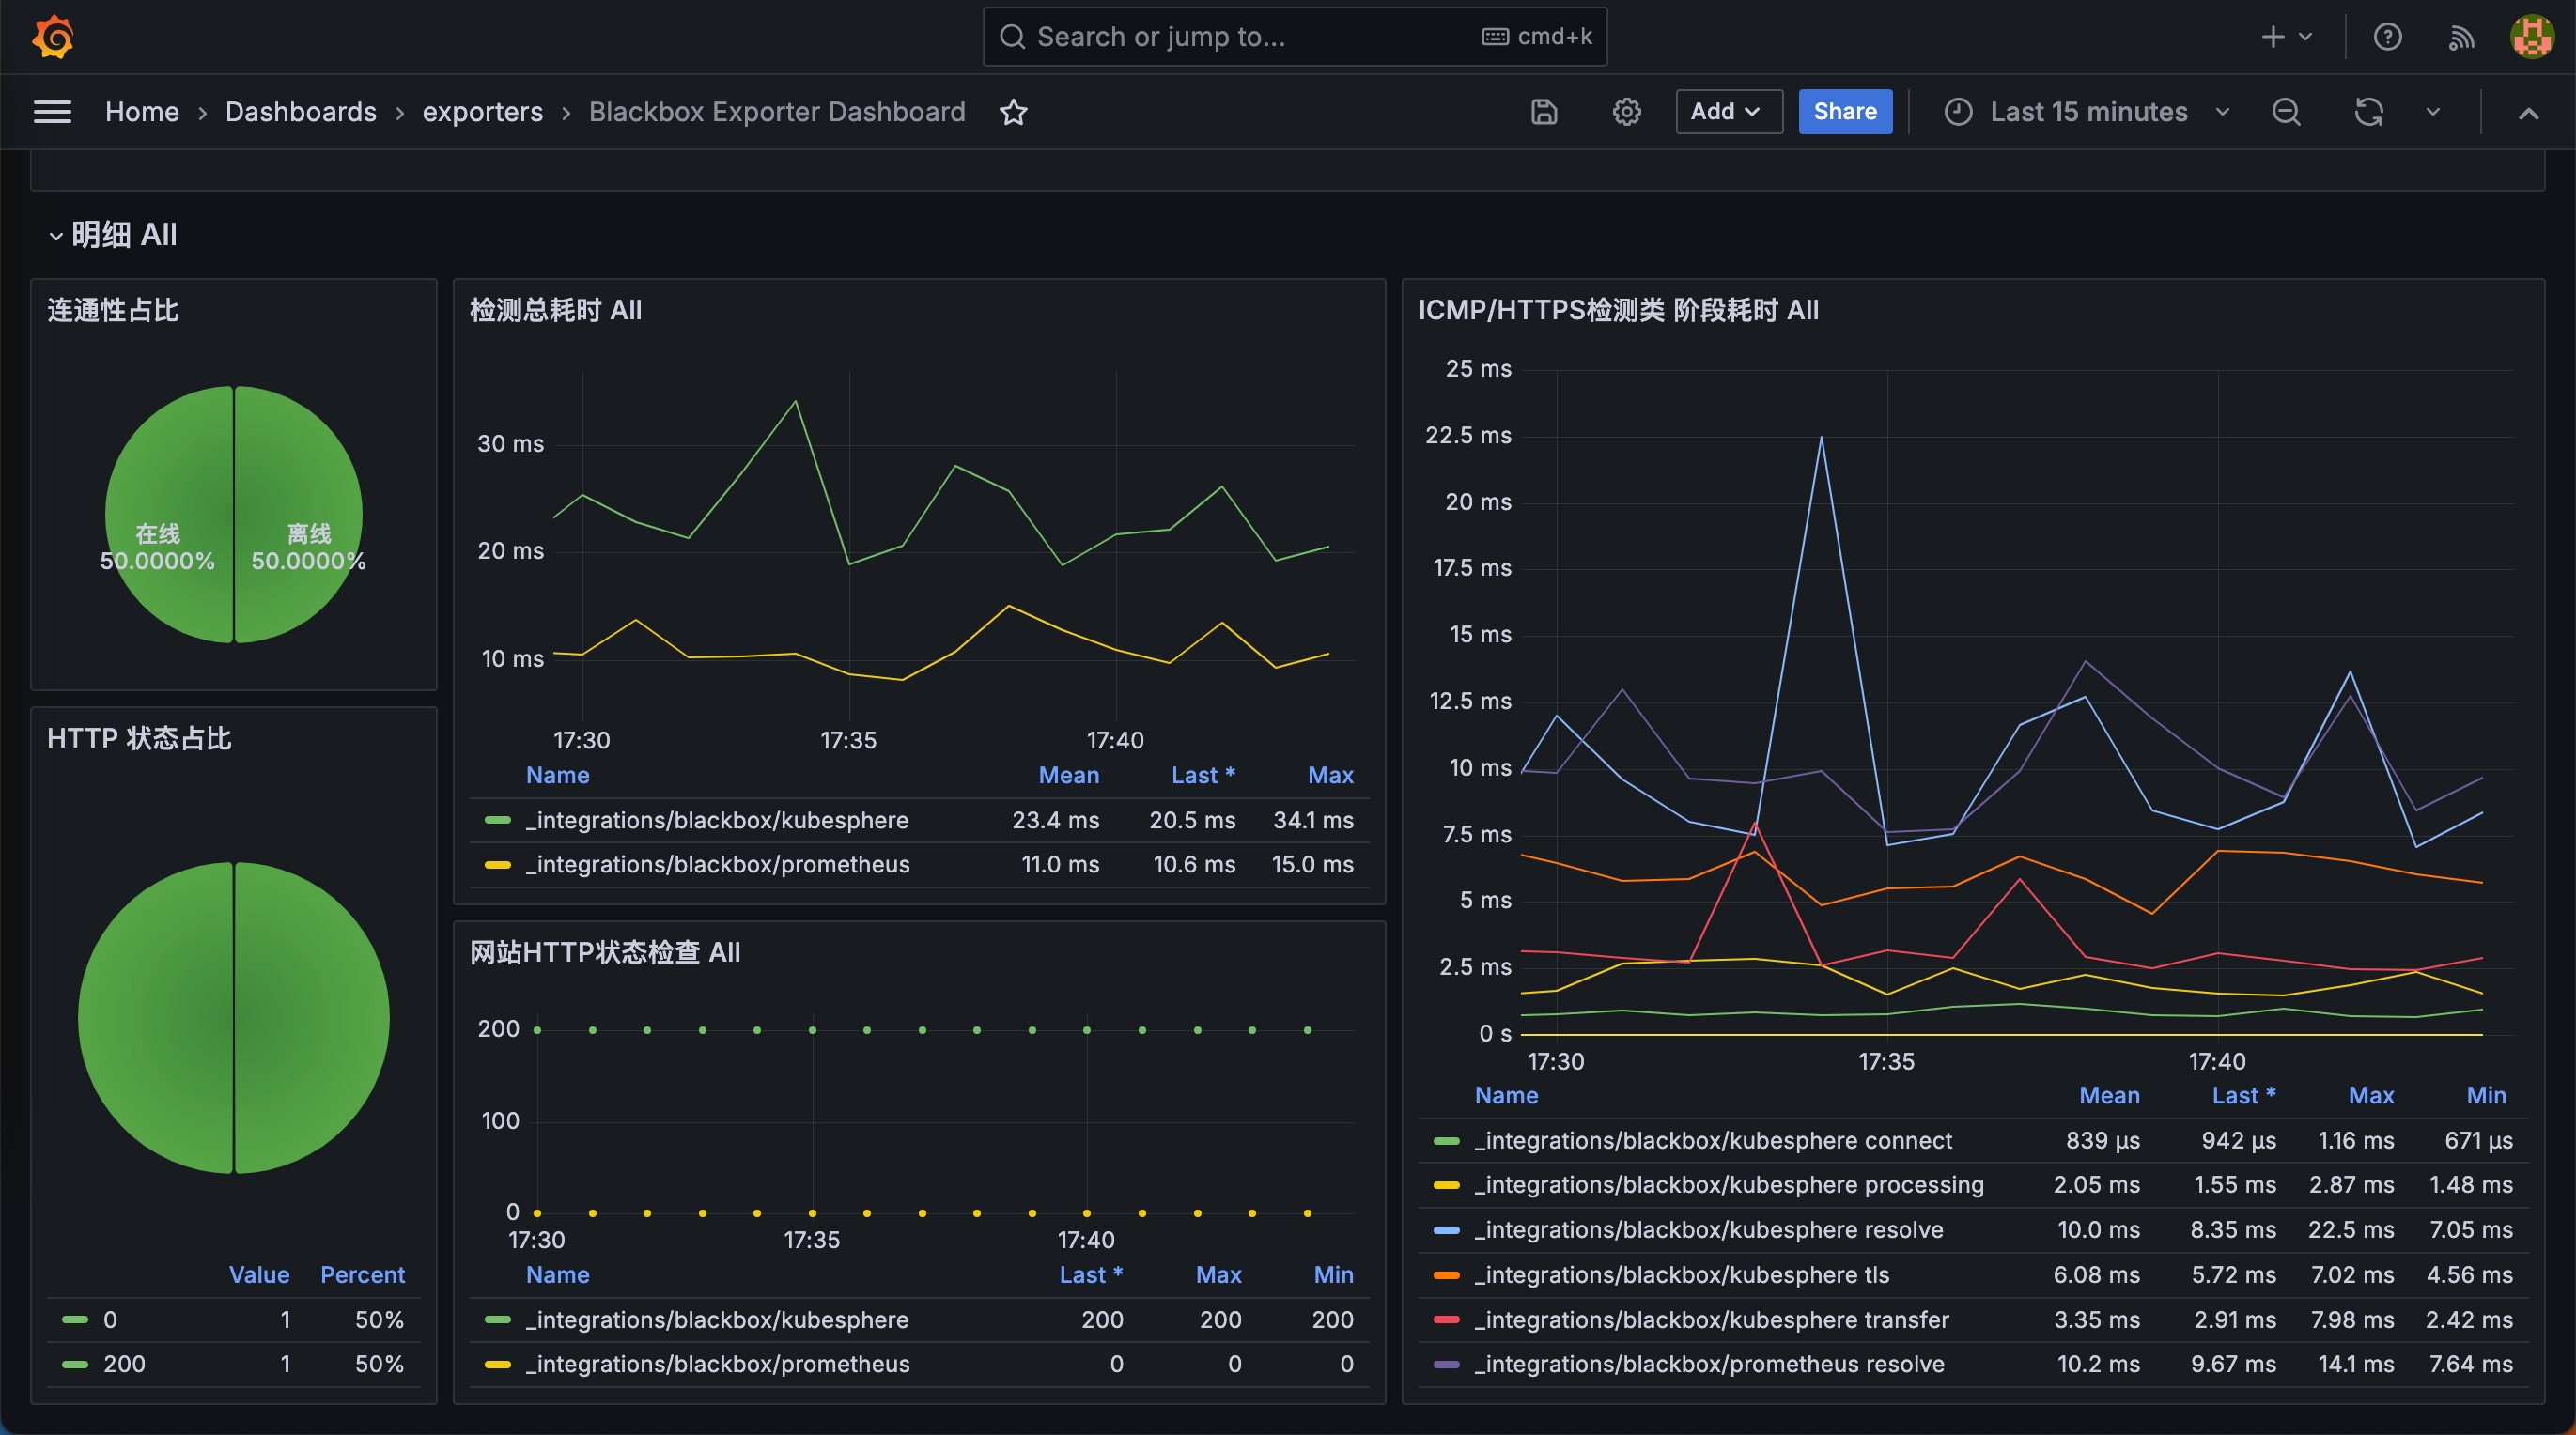
登录 Grafana for WizTelemetry 扩展组件提供的 Grafana 控制台,访问内置的 Blackbox Exporter Dashboard,查看相应指标。